Determining container terminal energy requirements
Introduction
Decarbonization is a worldwide trend that is observed across virtually any industry. Container terminals are no exception and electrification is the way to go. Many terminals currently rely on diesel driven transport vehicles (terminal trucks, straddle carriers). At this time more and more battery driven options are becoming available. However, the switch to electric equipment poses challenges to terminal operators that must accommodate the growing energy requirements.
Specifically, switching to battery powered horizontal transport is a tough challenge. Regarding this topic, there are multiple questions that a terminal might ask itself:
- What is a good battery size for my operation?
- How many chargers do I need?
- Do I need to add more equipment to allow for charging?
- Can I make use of shift-changes and operational breaks?
- Which software should be responsible for charging equipment in time?
- What is the cheapest solution for charging equipment?
In this article we will show a case study of battery driven vehicles in a large scale container terminal operation (2,300m of quay with 22 quay cranes). Their batteries need to be charged with chargers while the terminal is operational and has no noticeable shift breaks.
Case study
Portwise’s approach is to simulate energy usage over a full year. The simulation focuses on a year of dynamic operations, keeping track of the active quay cranes per hour and the number of moves that are executed by the battery vehicles. This allows us to determine the energy consumption per hour and test different charging strategies.
The charging strategy used in this case study is to keep the fleet charged as much as possible. In peak STS operations with more than 15 cranes active, the amount of charging is reduced in order to keep sufficient vehicles available to handle the peak workload.
The results of the simulation with tests of 8, 10 and 12 charging points show that the energy level of the vehicle fleet fluctuates significantly over the year.
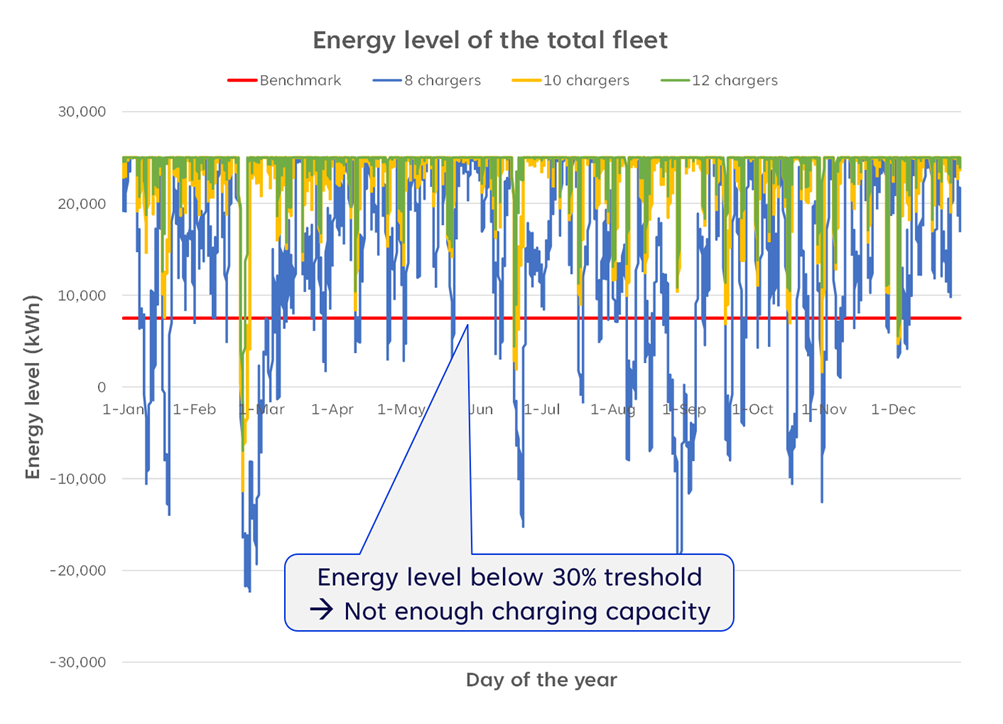
Energy level for the vehicle fleet over the year
Figure 1 shows that 8 chargers are not sufficient, because the capacity drops regularly below the critical threshold level of 30%. With 10 chargers the capacity is sufficient in most cases, while 12 charging points are able to keep the energy level almost constantly above the threshold. This means that 12 charging points are able to fulfill the energy requirement of the terminal.
Figure 2 presents energy consumption by chargers over the year. Deploying more charges clearly leads to higher peak consumption when all chargers are occupied. At the same time, this peak is reached far less often than when using fewer chargers. The figure shows that 8 chargers are quite frequently all in use, which is much more uncommon for 12 chargers.
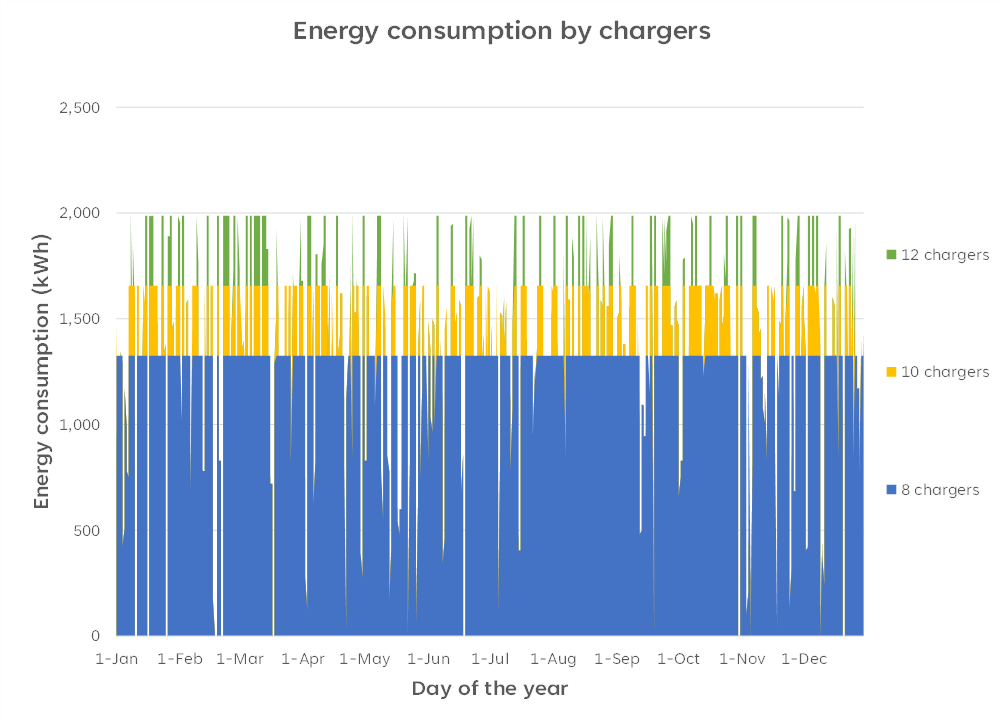
Energy charging network consumption over the year
Conclusion
This case study shows that simulation is a useful tool to gain insight into the requirement of number of chargers and power demand for a terminal using a realistic dynamic workload. Besides answering this question, it can also be used to test different battery sizes, effect of additional equipment and other charging strategies. And it can also be used to determine the effect of larger vessel call sizes, which will result in longer peak durations and therefore a larger charging infrastructure requirement. For all these types of questions, simulations can provide insights required to make the right decision.
By Pim van Leeuwen and Age Dijkstra